|
Types of 3D Visualizations
Goals
Design created using a digital workflow can be visualized in a variety of ways. Some visualization methods/types are mainly for modeling purposes, some are geared towards simulation or presentation.
It is important to note that different visualization types provide different information. This page introduces some examples.
Wireframe model
Maybe the simplest visualization of a 3D object is the wireframe model that describes the shape using line/arcs/curves. One can see through the objects in this mode, which can be beneficial (or a hindrance if there is are a lot of objects). The surface structure is clearly visible in this mode.
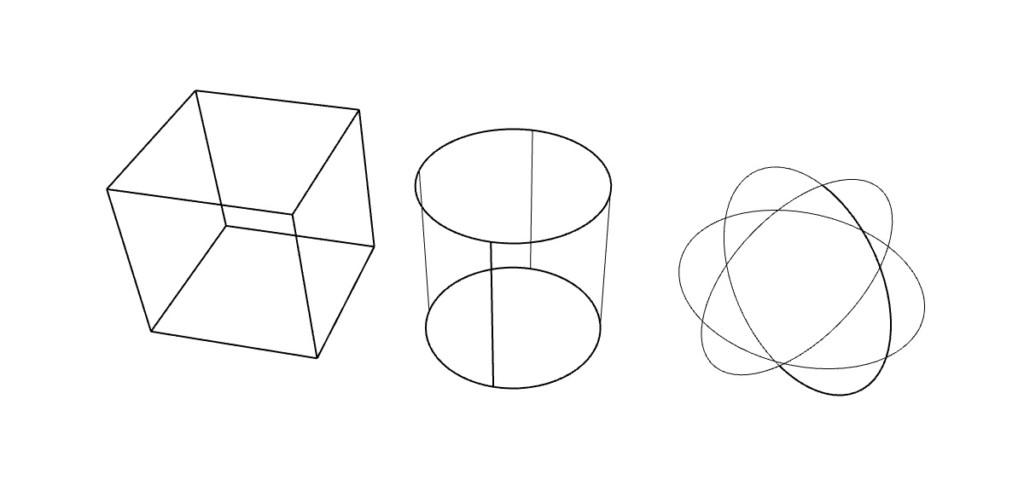
A wireframe model: Anssi Ahonen.
Shaded model
In a shaded model, the surface of the object is shaded using a simple light source. Since this mode is visually very clean & basic, it is great for analyzing the general shapes and surfaces of the model.
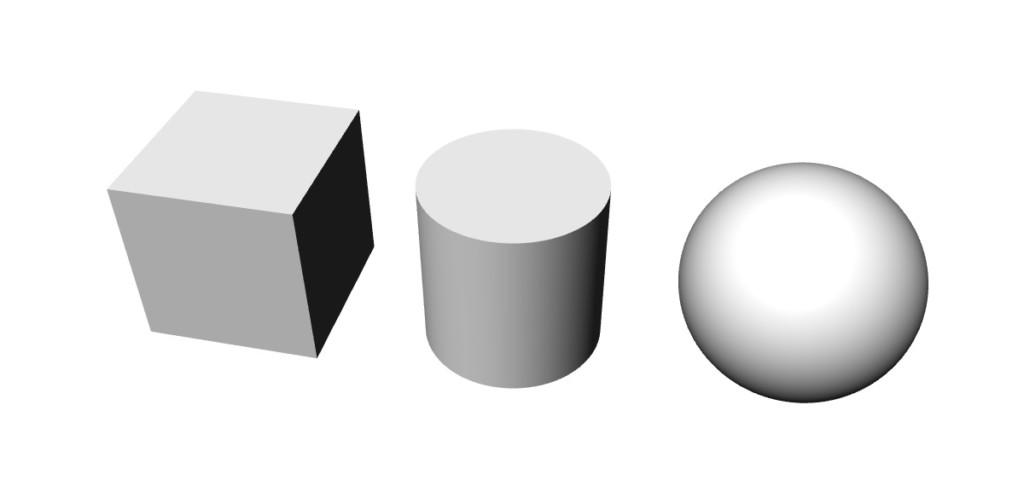
A shaded model: Anssi Ahonen.
Raytraced or pathtraced image
In a ray-traced or path-traced image, the image is created by simulating the interaction of the light (source), geometry, materials, and the camera. This creates a more realistic depiction of the scene. These sorts of images are great for analyzing the design and for presentations. Trying different materials and lighting can be very inspirational from a designer's point of view.
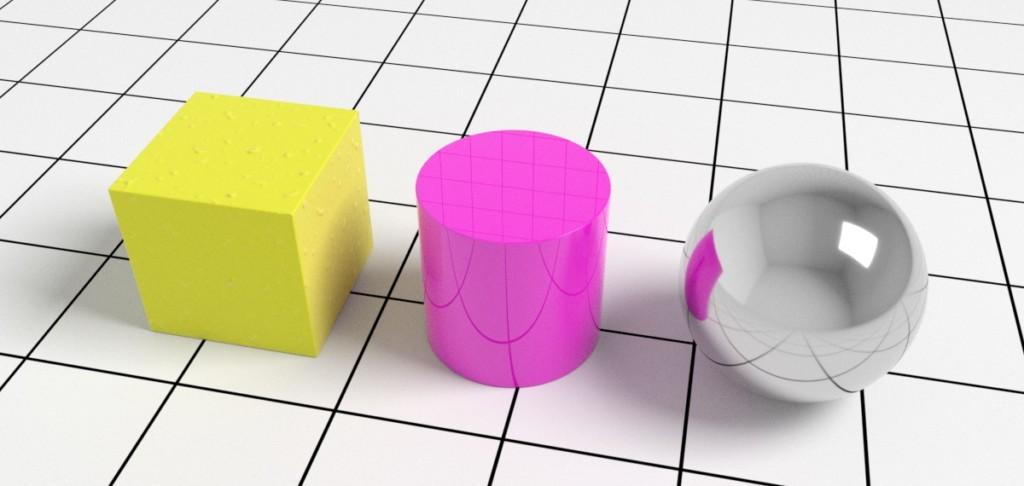
A raytraced/pathtraced image: Anssi Ahonen.
3D objects over a photo
3D images can be embedded into photographs which helps with realism. In addition, the 3D scene can be lit using an HDR image as a lighting environment. Matching background and HDR environment can produce very realistic lighting, reflections, etc.
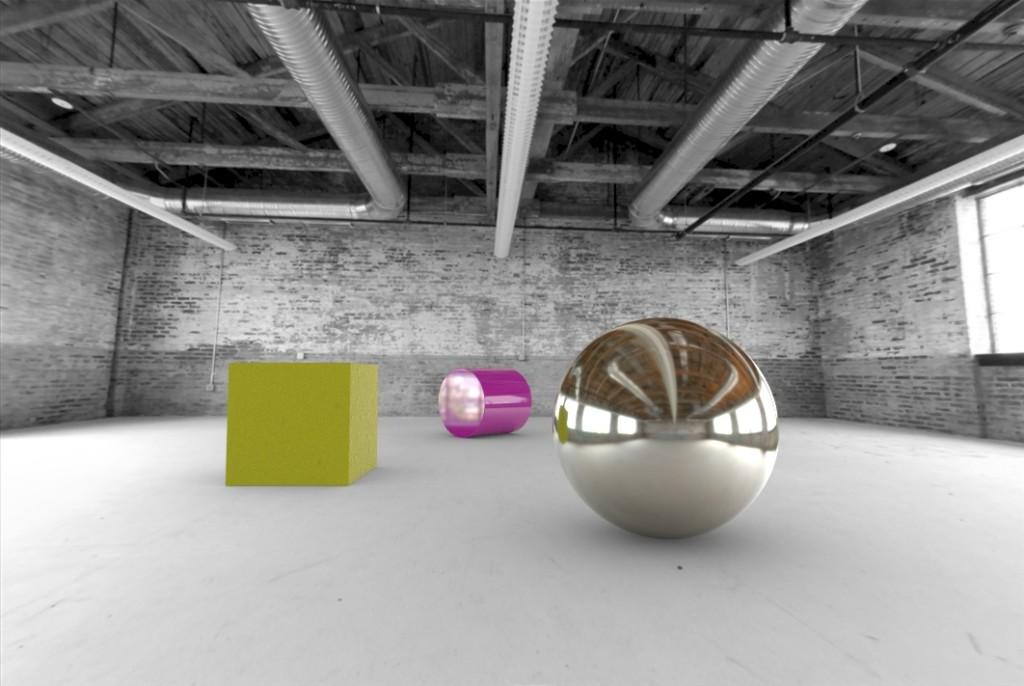
3D objects over a photo, lit with matching HDR image: Anssi Ahonen.
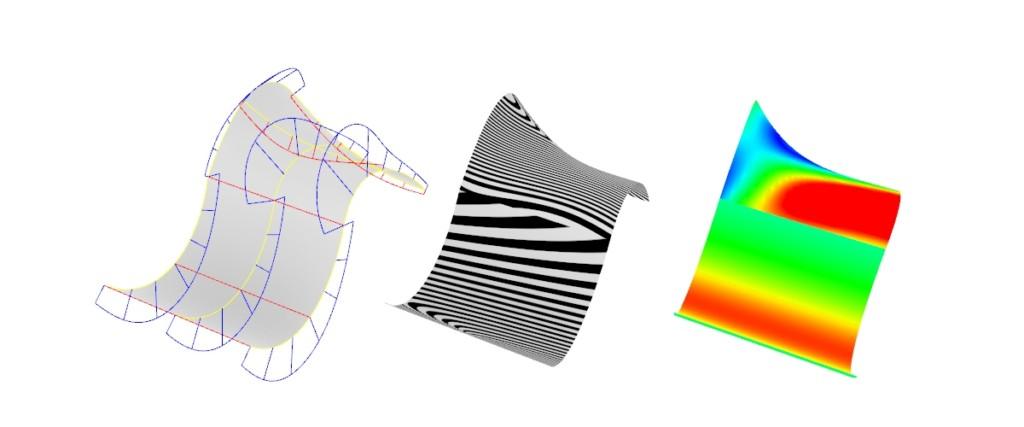
Visualizations describing surfaces and their technical qualities
Visualizations can describe surfaces and their technical qualities. Especially in advanced surface modeling, these sorts of tools are in heavy use in order to make sure geometry matches the needed standard/quality.